Why do the FC, DPPH, TEAC, and FRAP Methods give Different Sesults?
1Department of Chemistry and Biochemistry, Mendel University in Brno, Zemědělská 1665/1, 613 00 Brno, Czech Republic
2Department of Crop Science, Breeding and Plant Medicine, Mendel University in Brno, Zemědělská 1665/1, 613 00 Brno, Czech Republic
3Prof. Klejdus died on September 1st, 2020
Author and article information
Cite this as
Stratil P, et al. Why do the FC, DPPH, TEAC, and FRAP Methods give Different Sesults?. Open J Chem. 2026; 12(1): 21-32. Available from: 10.17352/ojc.000048
Copyright License
© 2026 Stratil P, et al. This is an open-access article distributed under the terms of the Creative Commons Attribution License, which permits unrestricted use, distribution, and reproduction in any medium, provided the original author and source are credited.Reactivity of non-hydroxy- and hydroxy-derivatives of benzoic acid, benzaldehyde and cinnamic acid was investigated by FC, DPH, FRAP and TEAC methods. The non-hydroxyderivatives were non-reactive with the methods. The reactivity of analysed compounds (expressed by micromolar absorption coefficient) determined by the FC method depends on the type of phenolic compound, the number of bound hydroxyl groups, their positions on the benzene ring, and eventual presence of other substituents. The values were generally low. FRAP: only monohydroxy derivatives of cinnamic acid and other benzene derivatives having an additional one or two methoxy groups and o,m- or p,m- dihydroxy derivatives reacted. DPPH: from monohydroxy derivatives, only cinnamic acid derivatives having a methoxy group and benzene derivatives having two methoxy groups reacted. Dihydroxy derivatives reacted similarly as found for the FRAP method. TEAC: all analysed compounds containing hydroxyl groups reacted with various intensities. The method gave higher values than other methods used. Derivatives with substituents in o,p- or m,m- position (with the same electron density) were more reactive. Derivatives with three and four hydroxyl groups: higher reactivity had those with hydroxyl groups in o,m- or p,m- positions and greater molecule symmetry. TEAC method provides the best information about the antioxidant activity of the examined phenolic compounds.
AAPH: 2,2´-Azobis(2-Amidinopropane) Dihydrochloride; ABTS: 2,2´-Azino-Bis-(3-Ethylbenzothiazolin-6-Sulfonate) Diammonium Salts; AF: Acetophenone; AIBN: Azoiso-butyrylnitrile; Aox: Antioxidant; BA: Benzoic Acid; Bal: Benzaldehyde; CA: Cinnamic Acid; DPPH: Diphenylpicrylhydrazyl Method; ET: Electron Transfer; FC: Folin Ciocalteu Method; FCR: Folin-Ciocalteu Reagent; FRAP: Ferric Ion Reducing Antioxidant Power Assay; HAT: Hydrogen Atom Transfer; IIAL: Inhibition Of Induced Auto-Oxidation Of Lipids; IOU: Inhibited Oxygen Uptake; MAC: Millimolar Absorptivity Coefficient; ORAC: Oxygen Radical Absorbance Capacity; PBS: Phosphate Buffered Saline; SET: Single Electron Transfer; TAA: Total Antioxidant Activity; TEAC: Trolox Equivalent Antioxidant Capacity; TPTZ: 2,4,6-Tris(2-Pyridyl)-S-Triazine; TRAP: Total Radical Trapping Antioxidant Parameter
Introduction
Several methods are widely used for the assessment of antioxidant activity (AO). The values determined by these methods significantly differ, depending on the reactivity of their prime reagents. Hydroxy derivatives of benzoic and cinnamic acids are secondary metabolites found in plants that participate in total AO [1] health-beneficial compounds able to eliminate reactive oxygen radicals. [2] Several methods for the determination of AO have been developed and applied to food samples, food supplements, medicinal plants, algae and cyanobacteria, feed and fodder, etc. [3-7] The comparison of data from different sources is complicated due to different methods for analyte extraction and AO determination, often using different standards. [8] Extraction and isolation methods can be standardized, but it is not possible to eliminate the different reactivity of individual phenolic compounds with primary reagents of individual AO methods, which are given by the chemical properties of individual compounds. [9,10].
AO assays can be roughly divided into two categories: (1) hydrogen atom transfer (HAT) reaction-based assays and (2) single electron transfer (SET) reaction-based assays. The methods based on HAT, such as ORAC (Oxygen Radical Absorbance Capacity), TRAP (Total Radical Trapping Antioxidant Parameter), Crocin or ß-carotene bleaching, and IIAL (Inhibition of Induced Auto-oxidation of Lipids), all have alkylperoxyl radicals as primary reagents. Radicals are highly reactive with fatty acids, proteins, carotenoids, and various antioxidants. [11] Thanks to the primary reagents, HAT-based methods provide similar results when compared to each other.
The SET-based methods have different primary reagents with non-identical reactivity; therefore, they provide different values for the same compound. In the case of benzoic and cinnamic acid derivatives, some of the SET-based methods do not detect certain analytes at all, while others give strong responses. This study aimed to compare the reactivity of selected secondary metabolites found in plants – 43 different benzoic and cinnamic acid derivatives - determined by the most common AO methods: Folin Ciocalteu method (FCM), [12,13] often used for the determination of total phenolic compounds, diphenylpicrylhydrazyl (DPPH), [11,14] Ferric ion Reducing Antioxidant Power assay (FRAP) [15,16] and Trolox Equivalent Antioxidant Capacity (TEAC). [17-19] The reactivity is expressed and compared in values of Millimolar Absorptivity Coefficient (MAC). The millimolar absorptivity coefficient, usually marked εmM or εmM-1cm-1, measures how strongly a chemical compound absorbs light at a specific wavelength per millimolar concentration. A detailed description is given [20]. While the principles of the methods used are different, the same sets of standard solutions were used for the model study, and all measurements were performed using the same instrumentation to keep the results as comparable as possible. To our knowledge, more detailed information about the reactivity of individual derivatives of benzoic and cinnamic acid according to individual AO methods is so far not available. Results of this research can significantly contribute to a better understanding of the primary reagent reactivity of the AO method according to antioxidant compound structure, to the evaluation of the objectivity of values determined by different methods, and to increasing possibilities to compare results obtained by individual methods. For some of the analytes, the most suitable method with the highest sensitivity can be selected based on the structure of monitored antioxidants.
Materials and methods
Chemicals
2,2-diphenyl-1-picrylhydrazyl radical (DPPH, »90.0%) and 2,2´-azino-bis-(3-ethylbenzothiazolin-6-sulfonate) diammonium salts (ABTS, »98.0%) were purchased from Sigma-Aldrich Chemical Co. (St. Louis, MO, USA).Folin-Ciocalteu reagent (FC reagent) and 2,4,6-tris(2-pyridyl)-s-triazine (TPTZ, puriss, »99.0%) were from Fluka Chemie (Buchs, Switzerland). Isoflavones, phenolic acids and their derivatives (see Table 1 and Appendix A) and all other reagents of ACS purity were purchased from Sigma-Aldrich. Other chemicals of p.a. purity were from Pliva-Lachema (Brno, Czech Republic). All reagents and standard solutions were prepared using Milli-Q deionized water (Millipore, Bedford, MA).
Real samples, sample pretreatment and extraction
7 algae and cyanobacteria samples with different content of antioxidants: Chantransia, Chlorococcum, Desmodesmus, Klebsormidium, Scenedesmus, Stigeoclonium and Cyanobacteria UTEX, obtained from the Institute of Microbiology, CAS, Centre Algatech, Třeboň, Czech Republic, were used as real samples. Lyophilised algae powder underwent acidic hydrolysis, sonication, and microwave extraction before the determination of antioxidant activity.
10 mg of algae sample (dried weight) was mixed with 0.5 mL of 2 M HCl and extracted using an ultrasonic homogenizer SONOPULS mini20 (Bandelin electronic, Berlin, Germany) for 1 min and microwave reactor Anton Paar (Anton Paar GmbH, Graz, Austria) under following conditions: power 80, ramp 15 minutes, hold 90 minutes, maximum 120 °C and maximum pressure 25 bar. The samples were transferred to the nitrogen blow-down evaporator Stuart P-LAB (Bibby Scientific Ltd, UK), evaporated, mixed with 80% acetone and centrifuged using Microcentrifuge 5417R (Eppendorf AG, Hamburg, Germany) at 25 000 g and 4 °C for 10 min. The method was originally developed for cells; a more detailed description is given in the paper [21].
Spectrophotometry and chromatography
For MAC determination, a spectrophotometer HELIOS b (declared reliability of measuring to 2.0 AU), controlled with the VISION 32 Software (Spectronic Unicam, Cambridge, GB), was used. Chromatographic analyses of real sample extracts were performed using Agilent 1200 Series RRLC (on-line degasser, binary pump, HPSL auto-sampler, thermostated column compartment, UV/VIS diode array detector) coupled to Agilent Technologies 6460 Triple Quadrupole MS detector with Agilent Jet Stream (Agilent Technologies, Waldbronn, Germany). The Zorbax SB-C18 column (2.1 × 50 mm, 1.8 μm) was used under the following conditions: injection volume 5 μL, flow rate 0.8 mL min-1, column temperature 26 °C, mobile phase consisting of 0.2% (v/v) acetic acid in water and acetonitrile, linear gradient elution. Applied: 0 min 8% ACN, 0.79 min 8% ACN, 1.19 min 20% ACN, 1.99 min 20% ACN, 3.0 min 25% ACN, 3.5 min 8% ACN. The method was developed for the determination of phenolic compounds from sea algae extracts and is described in detail in a previous paper: [22]. RSDs varied in the range 0.13-3.48%; individual S.D. values were <5% with two exceptions at very low concentrations, 6.3% for vanillin and 7.02% for p(OH)benzaldehyde. For more details on recovery and precision, full data on real sample measurements are given in Appendix B. Full detailed statistical analysis is also included in the same file.
Methods
As stated above, AO assays can be roughly classified as HAT or electron transfer (ET), although these two reaction mechanisms can be difficult to distinguish in some cases. TEAC, FC, and FRAP assays are ET-based; AO capacity is measured as reduction of an oxidant, which changes colour when reduced. [11] The degree of colour change is proportional to the concentration of the antioxidant. The DPPH method is regarded as based on electron transport; the splitting of a hydrogen atom is a side reaction. [11,14]
FC method: The FC method (Folin-Ciocalteu method) was developed in 1927 and used for protein determination, based on the reaction of FC reagent (FCR) with tyrosine. [12] Singleton and Rossi [13] improved the method by using the molybdate-wolframate phosphate heteropolyanionic reagent (today commercially accessible Folin-Ciocalteu reagent): 3H2O–P2O5–13WO3–5MoO3–10H2O and 3H2O–P2O5–14WO3–4MoO3–10H2O that reduces phenols more specifically (lmax of product is 765 nm). Singleton and co-workers enhanced this method for determination of total phenolics in wine, and since then it has been used for many different applications [23]. The method is based on the reduction of the phosphowolframate-phosphomolybdate complex of probable constitution: (Ph-MoW11O40)4- / (Na2WO4 . 2H2O + Na2MoO4 . 2H2O) + H3PO4 + HCl. The coloured product has an absorption max. 745-750 nm. It is assumed that the molybdenum in this complex is more easily reduced and true electron transfer occurs among reductants (phenolate anion, Ph-O-) and Mo6+:
Mo6+ (yellow) + e ® Mo5+ (blue)
Ph–OH ® Ph-O- +H+
Ph-O-+ FCR + e/2e ® (Ph-MoW11O40)4- (blue)
The method measures the sample reducing capacity. FC reaction is non-specific for phenolic compounds, which react only in alkaline solution, at ca. pH 10. Phenolate anion capable of reducing FCR is formed at the dissociation of the phenolic proton (H+). Excellent linear correlation between total content of phenolic compounds and AO determined by FRAP, TEAC, or other methods) was described in many publications. [24]
Used procedure: For each compound and for each used method, reactions were carried out for 6 different concentrations, and micromolar absorption coefficients were determined. 500 mL of commercial FCR (10 times diluted) was pipetted into the test tubes together with 0, 20, 40, 60, 80 and 100 μmol/L of each phenolic compound and mixed. The concentration range was selected with regard to similar reactivity for all compounds. After 10 minutes, 400 mL of 7.5% Na2CO3 solution was added, the volume adjusted with water to 1000 mL, and mixed. After 30 minutes, the absorbance was measured at 760 nm against blind sample (water in place of the tested compound). [8] Micromolar absorption coefficients as a measure of reactivity were determined by the spectrophotometer program VISION. Every compound was analysed three times by all used methods.
DPPH· method: The DPPH method (with 2,2-diphenyl-1-picrylhydrazyl radical) is based on the ability of the stable free radical 2,2-diphenyl-1-picrylhydrazyl to react with hydrogen donors (AH), including phenolic compounds. It was developed for the detection of H donors in natural materials. [25] Sánchez-Moreno and co-workers suggested a method with DPPH· radical for the determination of antioxidant capacity of vegetable and fruit juices and extracts. [18,19] DPPH· is one of the few stable organic nitrogenous radicals. It has dark purple (violet blue) colour (absorption maximum 515 nm) and is commercially available. DPPH method is based on electron transport, and split of a hydrogen atom is a side reaction [11,14] (Figure 1 and Figure 2). The radical DPPH· is an oxidizing radical; it means that it is reduced by antioxidants (AH):
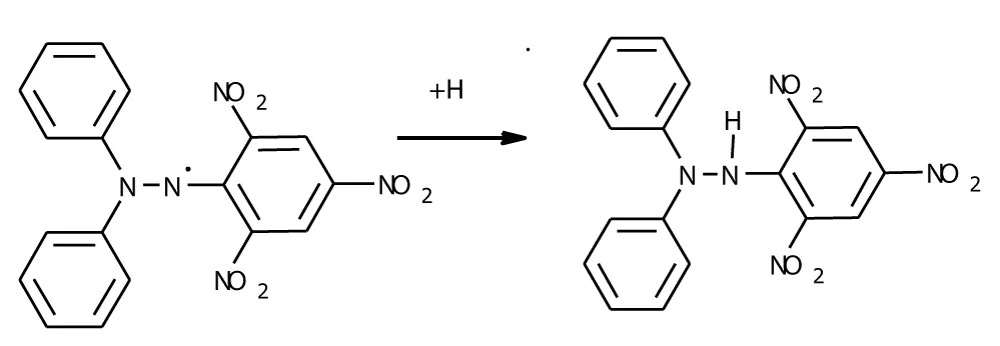
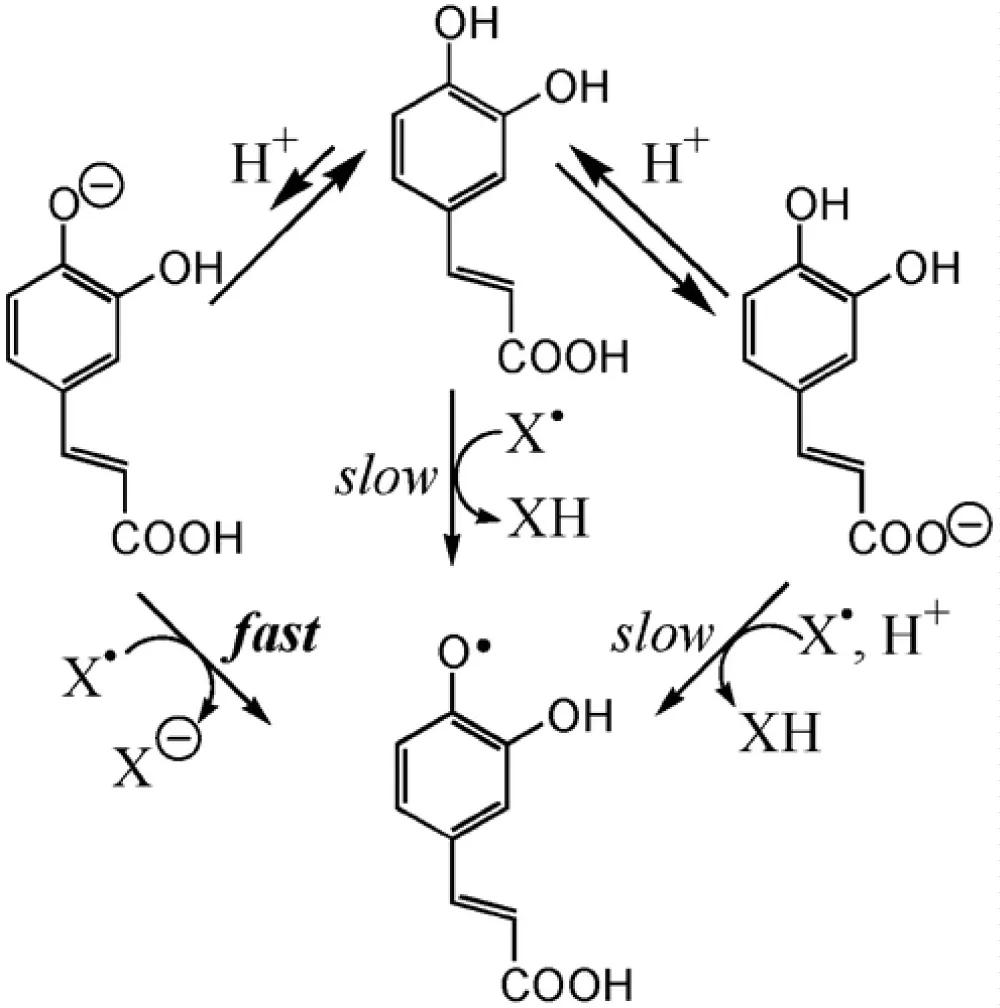
DPPH· + AH ® DPPH-H + A·
DPPH reagent is decolorized by reductants as well as by hydrogen transfer, which also contributes to the wrong interpretation of antioxidant capacity. Individual compounds react relatively quickly. The DPPH· radical is probably more selective with H-donors than the ABTS·+ radical. DPPH· is relatively stable; many antioxidants that react readily with reactive radicals react slowly or not at all with DPPH·. Unlike ABTS·+, DPPH· does not react with flavonoids that do not contain an OH group on the B ring [19] nor with aromatic acids containing only one OH group. [28]
Used procedure: Working solution, 98 mg DPPH·.L-1, was prepared by dilution of the reagent with methanol. 950 mL of DPPH diluted solution with absorbance ca. 1.5 absorption units (AU) was pipetted into six test tubes and 0, 10, 20, 30, 40 and 50 mL of solution of analysed phenolic compounds dissolved in H2O/MeOH (1:1, v/v). The highest concentration used depended on the reactivity of the individual tested phenolic compounds and was 10, 50, 100 and 1000 mmol.L-1. The volume was adjusted to 1000 mL with aqueous methanol. After 30 minutes of reaction, the decrease of absorbancy was measured at 515 nm. [8] MACs were determined as a measure of reactivity, using the spectrophotometer.
TEAC method: The TEAC method (Trolox Equivalent Antioxidant Capacity, or also TAA – Total Antioxidant Activity) is based on the reaction of antioxidants (Aox) with the long-term radical cation ABTS·+ (2,2'-azinobis-(3-ethylbenzothiazolin-6-sulphonic acid). The ABTS reagent is oxidized by oxidant (Ox) to radical cation ABTS·+ that is intensely coloured (Figure 3). [17] The redox potential (𝐸𝑜′) for ABTS/ABTS·+ is 0.68 V, high enough to react with most antioxidant compounds. [29] The radical ABTS·+ has a redox potential 68V a can reduce compounds with lower redox potential. Many phenolic compounds have redox potential low enough to react with ABTS·+. AO is measured by colour decrease at reaction of antioxidant with ABTS·+.
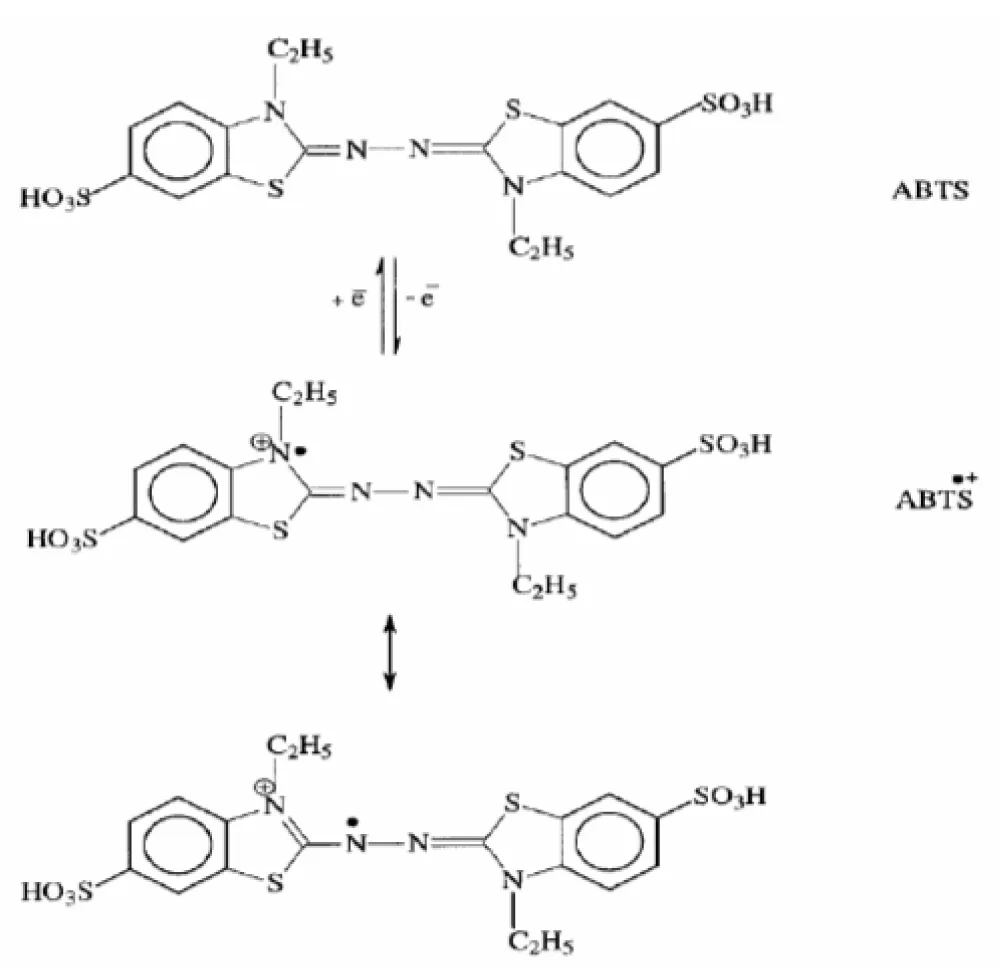
Metmyoglobin and H2O2 were originally used for the generation of ferrylmyoglobin radical that then reacted with ABTS to produce ABTS·+, [30] but the antioxidant could also react with an oxidizing compound, causing AO overvaluation [18], and the method was improved by using persulphate for ABTS oxidation. ABTS·+ is soluble in both polar and non-polar solvents and is not affected by ionic strength. The reaction mechanism can be influenced by pH; e.g., electron transfer is facilitated at acid pH. [19] An aqueous medium is more favourable for the reaction, though it can proceed in organic solvents. [31] Absorption maxima are at 415, 645, 734, and 815 nm. The most often used wavelengths are 415 and 734 nm. [32] Trolox equivalent is used for the expression of antioxidant capacity.
Used procedure: Working solution was prepared according to the original method. A solution of ABTS (7 mmol/L) was mixed with potassium persulfate, K2S2O8 (4.95 mmol/L) in proportion 1:1 (v:v) and left for> 12 hours in the dark at room temperature. ABTS·+ radical was prepared by PBS dilution (phosphate-buffered saline, pH 7.0) to a working absorbance of 1.0-1.5 AU at 734 nm. 975 mL of working solution was pipetted into six test tubes and 0, 20, 40, 60, 80, and 100 mL of each analysed phenolic compound solution of concentration 1 mmol/L. Total volume in the cuvette was adjusted with deionised water to 1000 mL. Absorbance was measured after 30 minutes of reaction time. [8] MAC was determined for each analyte.
FRAP method: The FRAP method (Ferric ion reducing antioxidant power assay) was originally developed by Benzie and Strain, 1996 [15,16] for measuring the reducing ability of blood plasma and adapted for measuring antioxidants in plants. [33-36] The assay is based on the reducing power of a compound (an antioxidant). A potential antioxidant reduced the ferric ion (Fe3+) to the ferrous ion (Fe2+); the latter forms a blue complex (Fe2+/tripyridyltriazine (TPTZ)). The FRAP reagent consists of acetate buffer (pH 3.6), TPTZ in 40 mM HCl, and FeCl3∙6H2O. The FRAP reagent is prepared by mixing the acetate buffer, TPTZ solution, and FeCl3∙6H2O solution in a proportion of 10:1:1 (v/v/v). [37]
Redox potential of Fe3+ salt is comparable to that of cation radical ABTS·+, 0.68 V (Figure 4). Therefore, some compounds react similarly in these two methods. There should not be a big difference in chemical principle between the two methods, except that FRAP is carried out at acidic pH 3.6 and TEAC at neutral pH. Fe3+ cation and TPTZ reagent form a chelate complex in an ideal stoichiometric rate 1: 2. Reaction of this complex with an antioxidant yields a coloured product due to reduction of Fe.
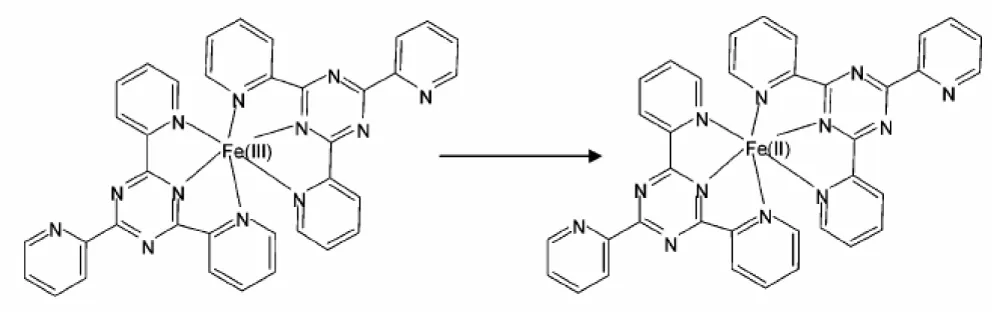
The method in fact measures only reducing ability based on the Fe3+ ion, which is not relevant to antioxidant activity from the physiological viewpoint. The reaction detects compounds with reducing potential < 0.7 V (redox potential of Fe3+-TPTZ). Reducing ability is in relation to hydroxylation and range of conjugation in polyphenols. [38] FRAP cannot detect compounds that influence inactivation of radicals (transfer of H), especially thiols and proteins. [39] FRAP values are usually lower than TEAC ones for the same set of antioxidant compounds. [39-41] The mechanism of the FRAP method is entirely electron transfer rather than a combination of SET and HAT. Reduced metals are active propagators of radical chain reactions over the reduction of hydroperoxides to RO·. High FRAP values might correlate with the tendency of polyphenols to become pro-oxidants under certain conditions. It was demonstrated for some flavones [42] that also have high levels of FRAP.
Used procedure: Solution 1: Acetate buffer pH 3.6 (3.1 g CH3COONa.3H2O and 16 ml of acetic acid/L). Solution 2: 10 mmol/L Fe3+-TPTZ in 40 mmol/L HCl. Solution 3: 20 mmol/L FeCl3.6 H2O. The working solution was prepared by mixing 10 volumes of solution 1 with one volume of each of solutions 2 and 3 and let react together for several minutes at 37 °C. Absorbance at 593 nm decreased from ca. 0.380 to 0.085 AU. 900 mL of working solution was mixed in six test tubes with 0, 20, 40, 60, 80, and 100 mL of analysed compounds. The highest concentrations depended on the reactivity of individual compounds and were 10, 20, 25, 50, 100, and 1000 mmol/L. The volumes were adjusted with re-distilled water to 1000 mL. Absorbance was measured after 30 minutes of reaction. [43] MAC was determined for every compound by means of a spectrophotometer program.
Results and discussion
Reactivity of analysed phenolic compounds
Reactivity of individual phenolic compounds, non-hydroxy and hydroxy-derivatives of benzoic acid, benzaldehyde and cinnamic acid was investigated by FC, DPH, FRAP and TEAC methods. Used shortcuts: BA = benzoic acid; BAl = benzaldehyde; CA = cinnamic acid; OH = hydroxyl group; Me = methoxy group; ~ = approximately the same value; < = higher value; ≤ = very similar value; o2, o3, m3 and m5 are o-, m-, and p- positions of substituents on the carbon atom of the benzene ring.
Reactivity of the compounds determined by the FC method
Reactivity of derivatives with one OH group (13 compounds) (Figure 5): 10 investigated metabolites did not react at all (Table 1); the rest reacted in the following order: 4-OH-3,5-Me, M-CA < 4-OH-3-Me-CA < 4-OH-3,5-Me, Me-BA. The strength of the OH group bond is following: o- < p- < m-. Thus, the reagent reacted with monohydroxy derivatives only if a methoxy or dimethoxy group was present (methoxy and dimethoxy cinnamic acid and dimethoxy benzoic acid). Only with those derivatives was the reagent able to form sufficiently stable radicals.
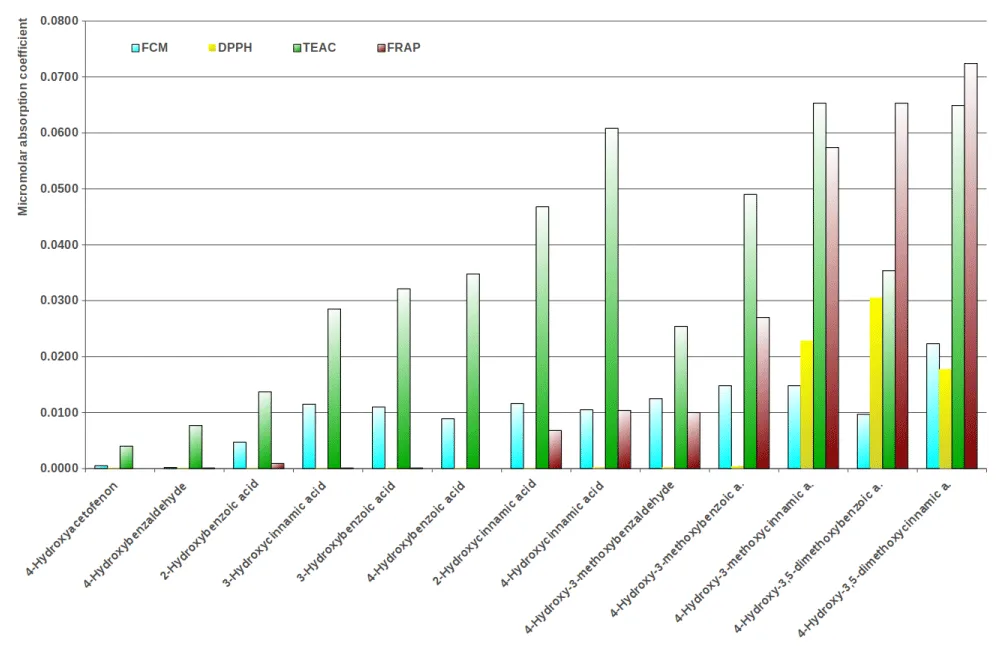
Observations obtained in this study for benzoic and cinnamic acid derivatives are contrary to reports by other research groups. According to other studies, any phenolic compound, including phenol itself, reacts with DPPH. [44]
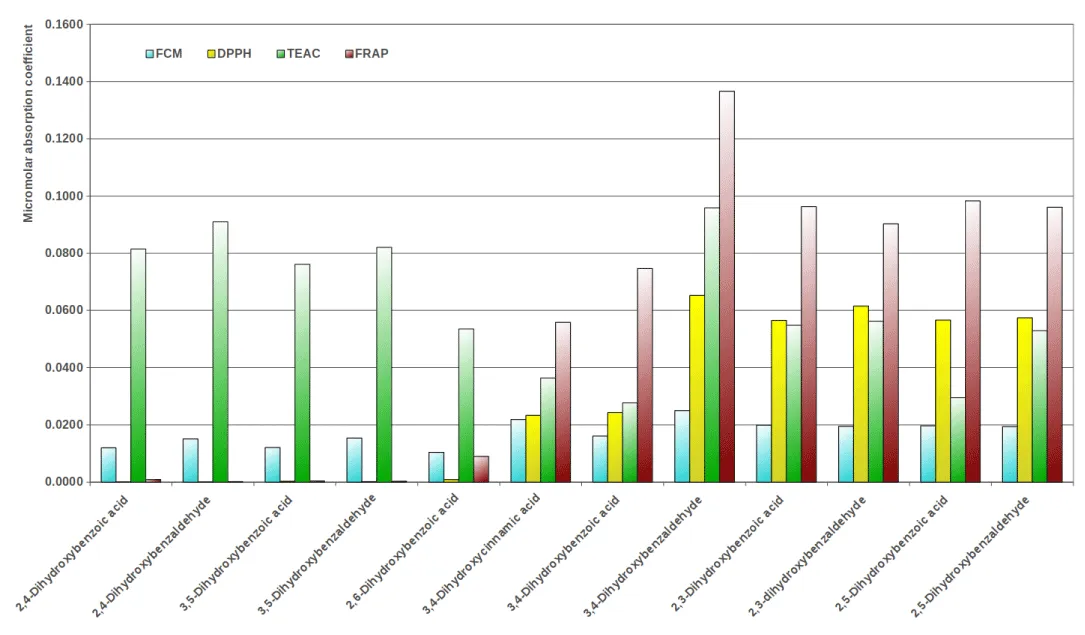
Reactivity of derivatives with two OH groups (12 compounds) (Figure 6): The values for the dihydroxy derivatives were similar; m,p-, o,m3- and o,m5- derivatives of dihydroxy benzoic acids and dihydroxy benzaldehydes had approximately two times higher values than the derivatives with one OH group and other derivatives with two groups (Table 2). Dihydroxy derivatives of benzoic acids and dihydroxy benzaldehyde derivatives with hydroxy groups in the positions o,o-, o,p-, m,m- showed much lower values than those in the combination with meta position, i. e. in positions m,p-, o,m3-, o,m5: 2,6-(OH)2-BA ~ 2,5-(OH)2-BA ~ 2,4-(OH)2-BA ≤ 2,4-(OH)2-BAl ~ 3,5-(OH)2-BAl.
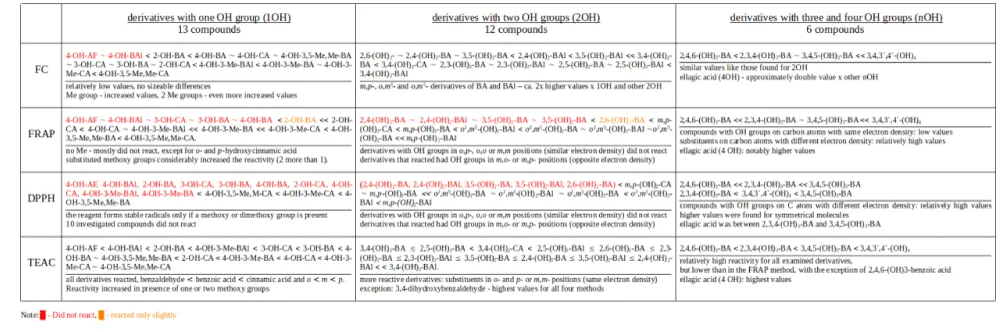
Dihydroxybenzaldehyde was more reactive than dihydroxybenzoic acid. The 3,4-, 2,3- and 2,5-dihydroxybenzoic acid derivatives and 3,4-, 2,3- and 2,5-benzaldehyde gave approximately two times higher values than the derivatives with one OH group and other derivatives with two groups.
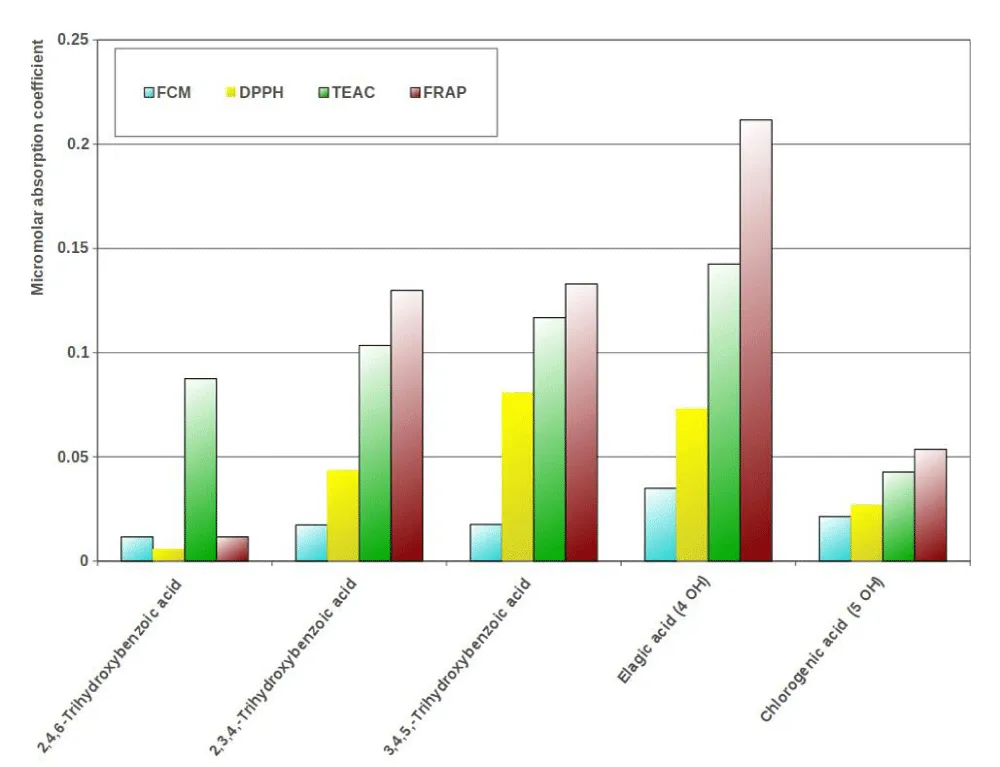
Reactivity of derivatives with three and four hydroxyl groups (6 compounds) (Figue 7): The compounds with hydroxyl groups on the carbon atom of the benzene ring with substituents in m,o- or m,p- positions had relatively high values. Higher values were found for the symmetrical molecules. Ellagic acid had values between those of the 2,3,4- and 3,4,5- derivatives (Table 1).
Reactivity of the compounds determined by the FRAP method
Reactivity of derivatives with one OH group (Figure 5): Some derivatives that did not react at all (4-OH-AF, 4-OH-BAl, 3-OH-CA, 3-OH-BA, 4-OH-BA), and 2-OH-BA reacted only very slightly. The order of reactivity is given in Table 2.
Reactivity increased as follows: AF < BAl < BA < CA and m < o << p. Substituted methoxy groups considerably increased the reactivity (two groups more than one group). The order of reactivity was: p-OH-3-Me-BAl << p-OH-3-Me-BA << p-OH-3-Me-CA < p-OH-3,5-Me, Me-BA < p-OH-3,5-Me, Me-CA. Monohydroxy derivatives without a methoxy group mostly did not react, except for o- and p-hydroxycinnamic acid.
Reactivity of derivatives with two OH groups (Figure 6): Derivatives with substituted hydroxyl group on carbon atom of benzene ring with similar electron density, no matter if higher or lower, did not react; i.e. all derivatives that have OH groups in o,p-, o,o or m,m positions; namely 2,4-(OH)2-BA, 2,4-(OH)2-BAl, 3,5-(OH)2-BA and 3,5-(OH)2-BA did not react, only 2,6-(OH)2-BA reacted weakly.
Compounds with OH groups in combination of meta and ortho or para positions, it is m,o- or m,p- positions, that is substituted hydroxyl groups on carbon atoms of benzene ring with opposite electron density, reacted in the order: m,p-(OH)2-CA < m,p-(OH)2-BA < o2,m3-(OH)2-BAl < o2,m3-(OH)2-BA ~ o2,m5-(OH)2-BAl ~o2,m5-(OH)2-BA << m,p-(OH)2-BAl.
Reactivity of derivatives with three and four hydroxyl groups (Figure 7): Compounds with hydroxyl groups on carbon atoms of the benzene ring with the same electron density had low values; those with substituents on carbon atoms with different electron density had relatively high values. Ellagic acid (4 OH) had notably higher values. The order was: 2,4,6-(OH)3-BA << 2,3,4-(OH)3-BA ~ 3,4,5-(OH)3-BA << 3,4,3´,4´-(OH)4
Reactivity of the compounds determined by the DPPH method
Reactivity of derivatives with one OH group (Figure 5): 10 investigated metabolites did not react at all (see Table 2); the rest reacted in the following order: 4-OH-3,5-Me, M-CA < 4-OH-3-Me-CA < 4-OH-3,5-Me, Me-BA. The strength of the OH group bond is following: o- < p- < m-. Thus, the reagent reacted with monohydroxy derivatives only if a methoxy or dimethoxy group was present (methoxy and dimethoxy cinnamic acid and dimethoxy benzoic acid). Only with those derivatives was the reagent able to form sufficiently stable radicals.
Reactivity of derivatives with two OH groups (Figure 6): Similarly to the FRAP method, the derivatives that have both substituted hydroxyl groups on the carbon atom of the benzene ring with similar electron density (compounds with OH groups in o,p-, o,o- or m,m- positions) almost did not react (see Table 2).
Compounds with OH groups in meta and ortho positions or in meta and para- positions (m,o- or m,p-) reacted similarly as found for the FRAP method: only the analytes with a substituted OH group on carbon atoms with opposite electron density reacted. Their reactivity was similar with the exception of m,p-(OH)2-cinnamic and m,p-(OH)-benzoic acids, which gave approximately half values (see Table X).
The reactivity of basic compounds increased in this order: cinnamic acid < benzoic acid < benzaldehyde, while 3,4-(OH)2-CA ≤ 3,4-(OH)2-BA << 3,4-(OH)2-BAl; 2,3-(OH)2-BA ≤ 2,3-(OH)2-BAl; 2,5-(OH)2-BA ~ 2,5-(OH)2-BAl and 2,3-(OH)2-BA ≤ 2,3-(OH)2-BAl.
Reactivity of derivatives with three and four OH groups (Figure 7): The compounds with hydroxyl groups on the carbon atom of the benzene ring with different electron density had relatively high values. Higher values were found for symmetrical molecules. Ellagic acid had values between those of the 2,3,4- and 3,4,5- derivatives (see Table 2).
Reactivity of the compounds determined by the TEAC method
The reagent used in the TEAC method is the most reactive and reacted with various intensity with all analysed hydroxyl derivatives. The order of reactivity is given in Table 2.
Reactivity of derivatives with one OH group (Figure 5): The derivatives of benzaldehyde were the least reactive among all monohydroxy derivatives. Reactivity of the basic compounds increases in a row: benzaldehyde < benzoic acid < cinnamic acid, and in a row: o < m < p.
The reactivity also increased in the presence of one or two methoxy groups: o-OH-BA < m-OH-BA < p-OH-CA; p-OH-BAl < p-OH-BA < p-OH-CA; p-OH-3-Me-BA < p-OH-3-Me-CA; p-OH-3-Me-CA < p-OH-3,5-Me, Me-CA
Reactivity of derivatives with two OH groups (Figure 6): In contradiction to the DPPH and FRAP methods, the more reactive derivatives were those which had substituents in o- and p- positions or m,m- positions, i. e., on carbon atoms of the benzene ring with the same electron density, not in m,o- or m,p-, except for the 3,4-dihydroxybenzaldehyde that gave the highest values for all four methods. It is the most important factor for this group of derivatives. Reactivity increases in row: m,p-(OH)2-BA < o2,m5-(OH)2-BA < o,o-(OH)2-BA ≤ o2,m3-(OH)2-BA ≤ m,m-(OH)2-BA ≤ o,p-(OH)2-BA.
Reactivity increases in the orders: for basic compounds: m,p-(OH)2-BA < m,p-(OH)2-CA; for benzaldehyde: o2,m5-(OH)2-BAl < o2,m3-(OH)2-BAl < m,m-(OH)2-BAl < m,p-(OH)2-BAl; for different o- and m- position: o2,m5-(OH)2-BA < o2,m5-(OH)2-BAl < o2,m2-(OH)2-BA < o2,m3-(OH)2-BAl.
Reactivity of derivatives with three and four OH groups (Figure 7): The reactivity was relatively high for all examined derivatives, but it was lower than in the FRAP method, with the exception of 2,4,6-(OH)3-benzoic acid.
The highest values were found for ellagic acid (4 OH):
2,4,6-(OH)3-BA < 2,3,4-(OH)3-BA < 3,4,5-(OH)3-BA < 3,4,3´,4´-(OH)4-ellagic acid.
TEAC values found for individual AO did not show unambiguous correlation among values of TEAC and the number of electrons that an antioxidant can release, and the number of hydroxyl groups, which can release a hydrogen radical H· [45]
Real samples
The results obtained for individual methods and analytes were compared with those obtained for real samples and found to be in good agreement. Extracts from 7 algae and cyanobacteria samples containing many of the above-studied analytes in different concentrations (Chantransia, Chlorococcum, Desmodesmus, Klebsormidium, Scenedesmus, Stigeoclonium and Cyanobacteria UTEX) were prepared, and their antioxidant activity was determined using all four investigated methods. At the same time, the concentrations of individual analytes in the extracts were measured accurately using RRLC with the 3QMS detector to find out which analytes were present in which sample and responsible for the antioxidant activity.
Antioxidation activity of the real samples
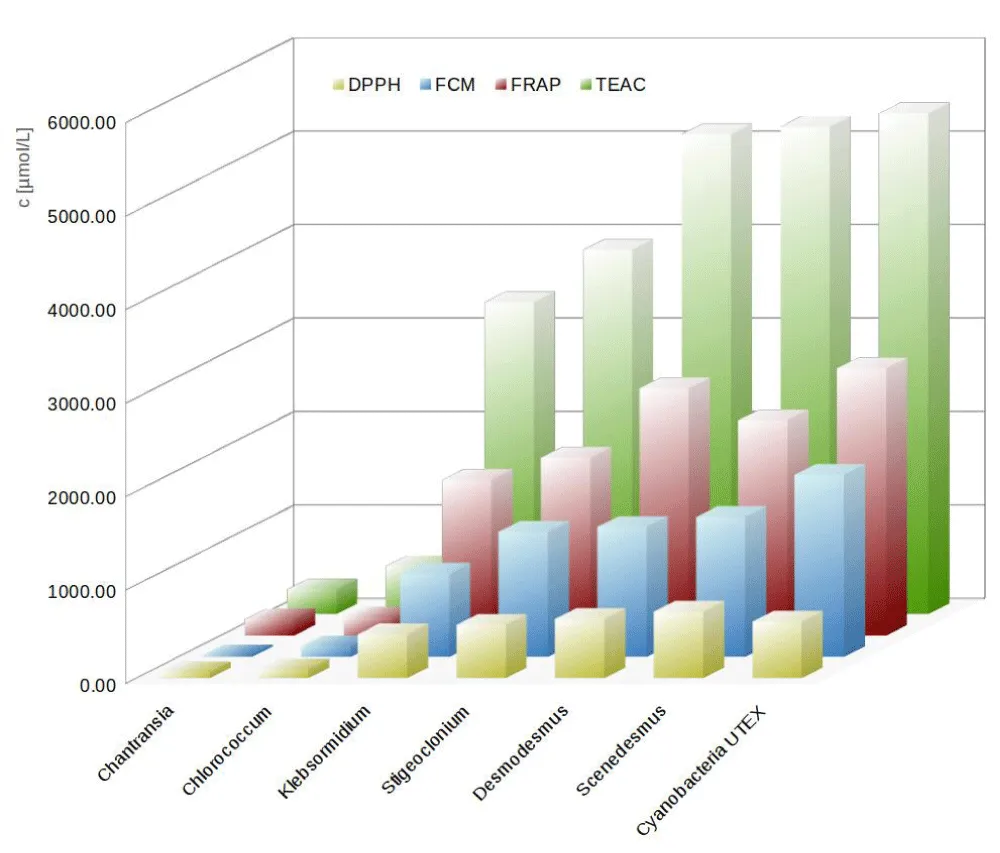
Antioxidation activity of real samples was determined by all four investigated methods using the same spectrophotometer. All measurements were done with n=3 on the same day, within several hours. Extracts from Chantransia and Chlorococcum, which had much lower concentrations compared to the others, were diluted 10x; the rest of the extracts were diluted 20x for FCM and DPPH, 40x for FRAP, and 100x for TEAC to obtain values within the range of concentrations used for calibration. The values of antioxidant activities are given in Table 3, and the comparison is shown in Figure 8. It can be clearly seen that although the obtained values are very different, the samples generally follow the same pattern, but there are differences in the results of individual methods.

Liquid chromatography - mass spectrometry determination
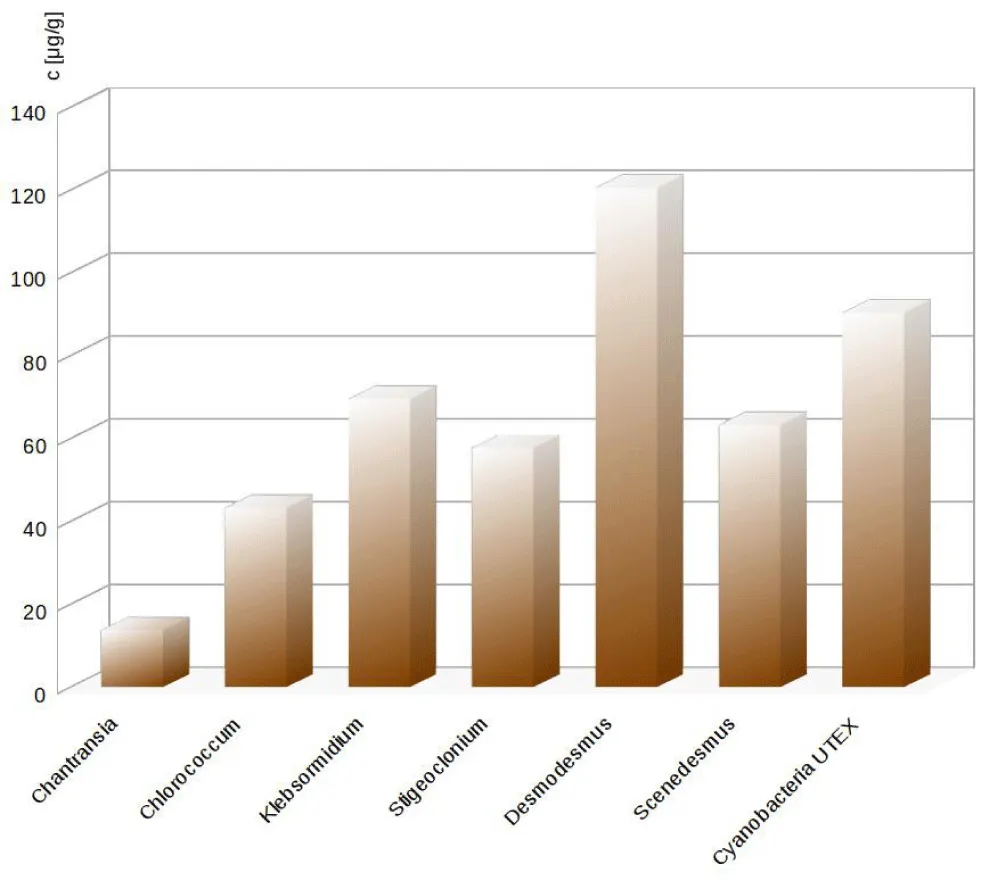
8 of the investigated analytes with one OH group - p-hydroxybenzaldehyde, salicylic acid, p-hydroxybenzoic acid, o-cumaric acid, p-cumaric acid, ferulic acid, vanillin, and vanillic acid - were present in the samples, as well as phloretic acid, another compound with one OH group not included in the spiked samples study. The samples also showed the presence of three important analytes with two OH groups - caffeic acid, protocatechuic acid and 3,4-dihydroxybenzaldehyde - and an analyte with three OH groups - gallic acid. Hydrocynamic acid was also found in several samples. Phloretic acid and hydrocynamic acid were added to the group of monitored analytes, because hydrocynamic acid was found to be the component with the highest concentration in Klebsormidium and Stigeoclonium samples and the second major component in the Desmodesmus sample, while phloretic acid was the analyte with the greatest concentration found in Cyanobacteria UTEX. The amount of individual antioxidants in samples in μg.g-1 is given in Table 4; the comparison of total antioxidant content is shown in Figure 9.
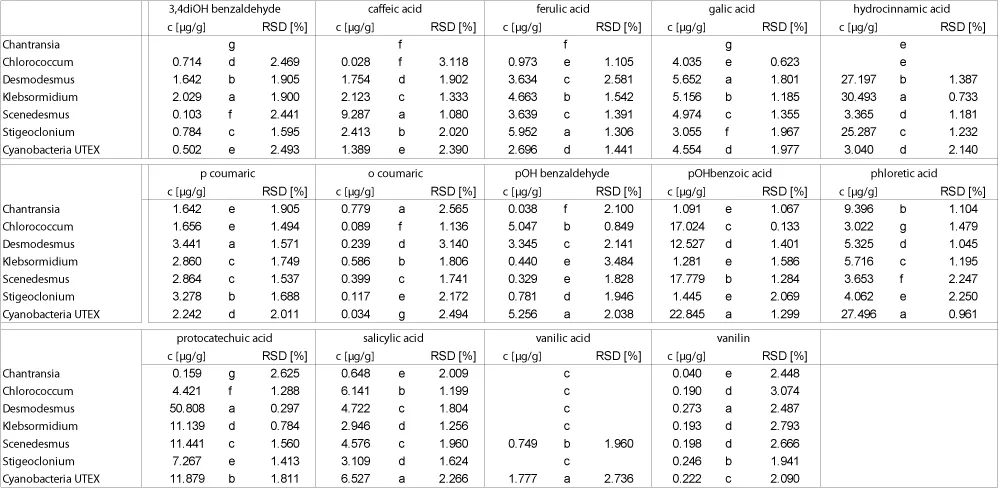
*Statistical analysis note: One-way ANOVA; Tukey HSD, family-wise α = 0.05; Cultures with a common letter are not significantly different; cultures without a common letter are different at p < 0.05; Shapiro–Wilk test
Extraction recovery and stability of the analytes
Microwave-assisted extraction was newly applied to the given real samples. The authors expect some loss of analytes to occur due to efficient extraction conditions, as flavonoid compounds are known to show partial degradation, especially during longer extraction times. [46,47]. However, the results were in good accordance with those obtained previously by the same team using other methods, like supercritical fluid extraction, accelerated solvent extraction, or hyphenated SFE/SPE. [48-50].
Application of the model hypothesis to real sample results
Expectations for antioxidation activity: According to the hypothesis created based on individual model samples, the following behaviour of analytes found in real samples was expected:
- p-hydroxybenzaldehyde: FC method - reacts only slightly, FRAP method - doesn’t react, DPPH method - doesn’t react, TEAC method - reacts, but gives the lowest response from all investigated monohydroxy analytes that reacted
- salicylic acid: FC method - reacts, but gives the lowest response from all investigated monohydroxy analytes that reacted, FRAP method - reacts only slightly, DPPH method - doesn’t react, TEAC method - reacts, but gives the second lowest response
- p-hydroxybenzoic acid: FC method - reacts, gives the second lowest response, FRAP method - doesn’t react, DPPH method - doesn’t react, TEAC method - reacts, medium response
- o-cumaric acid: FC method - reacts, relatively low values, FRAP method - reacts, but gives the lowest response, DPPH method - doesn’t react, TEAC method - reacts, medium response
- p-cumaric acid: FC method - reacts, relatively low values, FRAP method - reacts, but gives the second-lowest response, DPPH method - doesn’t react, TEAC method - reacts, gives the second-greatest response from all investigated monohydroxy analytes
- ferulic acid: FC method - reacts, relatively low values, FRAP method - reacts, high response, DPPH method - reacts, medium response, TEAC method - reacts, gives the highest response from all investigated monohydroxy analytes
- vanillin: FC method - reacts, relatively low values, FRAP method - reacts, but gives low response, DPPH method - doesn’t react, TEAC method - reacts, gives medium response
- vanillic acid: FC method - reacts, relatively low values, FRAP method - reacts, gives medium response, DPPH method - doesn’t react, TEAC method - reacts, gives high response.
All 2(OH) and 3(OH) analytes reacted with all methods and always FM < DPPH < TEAC Other antioxidants present in the sample: Antioxidation activity of real samples according to methods: The results obtained for real samples support the presented hypothesis. Chantransia contains low levels of analytes and mostly gives low responses. FRAP shows a higher response thanks to protocatechuic acid; TEAC shows the best response thanks to o- and p-coumaric acid and p(OH)benzoic acid and, supposedly, phloretic acid. Chlorococcum contains gallic acid, detectable by all methods. The major analyte is p(OH)benzoic acid, resulting in increased TEAC and slightly increased FC values. FRAP has a high response thanks to protocatechuic acid. DPPH has the lowest response; it is unable to detect p(OH)benzoic compounds and salicylic acid. Desmodesmus has two major analytes, protocatechuic acid detected by all methods, but with high response only by FRAP, and hydrocinnamic acid, which is supposed not to react at all. In this case, however, prospected higher response of FRAP to protocatechuic acid was outweighed by the TEAC reaction to other analytes, esp. p(OH)benzoic compounds that do not react with FRAP, and total results are more favourable for TEAC. In Klebsormidium, the main analyte is supposedly non-reactive hydrocinnamic acid, followed by Protocatechuic acid (detected by all methods, high response to FRAP) and gallic acid were detected by all methods with high responses. In total, generally stronger responses to a wider range of analytes showed the highest results for TEAC (Figure 8), despite the more favourable reaction of protocatechuic acid to FRAP. It can be seen that despite a high amount of hydrocinnamic acid, AO of Klebsormidium extract is much higher than that of Chlorococcum thanks to higher concentrations of analytes with stronger response to all methods (gallic, ferulic and caffeic acids, 3,4(OH)benzaldehyde). While Scenedesmus contains half the antioxidants compared to Desmodesmus (see Tab. 4), its antioxidant activity is comparable thanks to a more favourable distribution of analytes. Hydrocinnamic acid is a minor analyte here; TEAC response is high thanks to p(OH)benzoic acid, FRAP thanks to protocatechuic and caffeic acids. For most methods, measured values are slightly higher, except FRAP, where a high content of protocatechuic acid resulted in a stronger response for Desmodesmus. The amount of analytes in Stigeoclonium is not much lower compared to Scenedesmus, but AO is much lower, although not as low as Klebsormidium, despite its higher amount of analytes, which is in good accordance with the content of hydrocinnamic acid. Stigeoclonium contains several analytes detectable by all methods; protocatechuic acid is responsible for high FRAP response, phloretic and p-coumaric acids increased TEAC values. Cyanobacteria UTEX showed the highest values for all methods except DPPH, which is in good accordance with the low content of non-reactive hydrocinnamic acid and the hypothetical non-reactivity of the major analyte, phloretic acid, with DPPH. High TEAC values are caused mostly by phloretic and p(OH)benzoic acids, and FRAP by protocatechuic acid, together with compounds detectable well by all methods. FRAP results were better than those of Desmodesmus, despite a much lower amount of protocatechuic acid. Maximum FC values were measured for C. UTEX, despite higher concentrations of ferulic and gallic acid in the Scenedesmus sample, which were outweighed by low responses from high-content analytes.
Conclusions
FCM reactivity: reactivity of compounds analysed by the FC method depended upon the type of phenolic compound, the number of bound hydroxy groups, their position on the benzene ring, and eventually on the presence of other substituents. Resulting reactivity is then given by a varied combination of these factors. Generally, the values were low.
FRAP reactivity: from monohydroxy derivatives, only derivatives of cinnamic acid reacted, and from the others only the derivatives having an additional one or two methoxy groups. From the dihydroxy derivatives, only the derivatives with hydroxyl groups on carbon atoms of the benzene ring with opposite electron density (in o,m- or p,m- positions) reacted.
DPPH reactivity: from monohydroxy derivatives, only cinnamic acid derivatives having a methoxy group and other derivatives with two methoxy groups reacted. Dihydroxy derivatives reacted similarly as found for the FRAP method; i.e., with hydroxyl groups on carbon atoms of the benzene ring with opposite electron density (in o,m- or p,m- positions).
TEAC reactivity: TEAC reacted with various intensity with all analysed derivatives containing hydroxyl groups. It provided relatively high values (higher than the other used methods). Reactivity of investigated compounds depends, similarly to the FC method, on the type of phenolic compound, the number of bound hydroxyl groups, their position on the benzene ring, and eventually on the presence of other substituents. In contradiction to the DPPH and FRAP methods, the derivatives that had substituents on carbon atoms of the benzene ring in positions with the same electron density were more reactive. The resulting values of reactivity were given by different combinations of these factors.
Reactivity of derivatives with three and four hydroxyl groups: the derivatives with hydroxyl groups on carbon atoms of the benzene ring with different electron density and greater molecule symmetry had higher reactivity. The highest reactivity was found for gallic acid with three hydroxyl groups except for the DPPH method. Chlorogenic acid has 5 OH groups, but only two of them are on the aromatic ring; therefore, it reacted similarly to derivatives with two OH groups, in the following order: FCM < DPPH < TEAC < FRAP. Differences among these values were not too large.
The obtained results give us a better understanding of possible reactions for the investigated methods according to the individual analytes, and real sample experiments support the hypothesis. Thus, it is possible to select either a method with high total response for a wide group of the analytes of interest or the best method for the individual selected analyte according to its structure. These findings can help us to focus the strategy of selection of the method for antioxidant activity determination in the field of real samples, like functional food, food supplements, plant material, algae and cyanobacteria, or any other real matrix rich with metabolites that have favourable antioxidant properties.
Acknowledgement
The work has been supported by grant No. GA14-28933S from the Czech Science Foundation. Lea Lojková thanks the Internal Grant Agency of Mendel University in Brno, project no. AF-IGA2022-IP-037, for support during data evaluation and processing. Special thanks to Ing. Jiří Kopecký, Ph.D., from the Algal Biorefinery Group and RNDr. Pavel Hrouzek, Ph.D., from the Bioactive Compounds Group of the Centre Algatech, Institute of Microbiology, Czech Academy of Sciences, for the samples of algae and cyanobacteria, and to Mgr. Natalia Cernei, Ph.D., Department of Chemistry and Biochemistry, Mendel University in Brno, for microwave-assisted extractions.
- Shahidi F, Naczk M. Phenolics in food and nutraceuticals. Washington (DC): CRC Press LLC; 2004.
- Halliwell B, Gutteridge JMC. Free radicals in biology and medicine. New York: Oxford University Press Inc.; 1999.
- Vinson JA, Hao Y, Su X, Zubik L. Phenol antioxidant quantity and quality in foods: vegetables. J Agric Food Chem. 1998;46:3630-4.
- Vinson JA, Su X, Zubik L, Bose P. Phenol antioxidant quantity and quality in foods: fruits. J Agric Food Chem. 2001;49:5315-21. Available from: https://doi.org/10.1021/jf0009293
- Jiménez-Escrig A, Jiménez-Jiménez I, Pulido R, Saura-Calixto F. Antioxidant activity of fresh and processed edible seaweeds. J Sci Food Agric. 2001;81:530-4.
- Duan XJ, Zhang WW, Li XM, Wang BG. Evaluation of antioxidant property of extract and fractions obtained from a red alga, Polysiphonia urceolata. Food Chem. 2006;95:37-43.
- Plaza M, Santoyo S, Jaime L, García-Blairsy Reina G, Herrero M, Señoráns FJ, Ibáñez E. Screening for bioactive compounds from algae. J Pharm Biomed Anal. 2010;51:450-5. Available from: https://doi.org/10.1016/j.jpba.2009.03.016
- Stratil P, Klejdus B, Kubáň V. Determination of total content of phenolic compounds and their antioxidant activity in vegetables: evaluation of spectrophotometric methods. J Agric Food Chem. 2006;54:607-16. Available from: https://doi.org/10.1021/jf052334j
- Sauvesty A, Page F, Huot J. A simple method for extracting plant phenolic compounds. Can J For Res. 1992;22:654-9.
- Dai J, Mumper RJ. Plant phenolics: extraction, analysis and their antioxidant and anticancer properties. Molecules. 2010;15:7313-52. Available from: https://doi.org/10.3390/molecules15107313
- Huang D, Ou B, Prior RL. The chemistry behind antioxidant capacity assays. J Agric Food Chem. 2005;53:1841-51. Available from: https://doi.org/10.1021/jf030723c
- Folin O, Ciocalteu V. Tyrosine and tryptophan determinations in proteins. J Biol Chem. 1927;73:627.
- Singleton VL, Rossi JA. Colorimetry of total phenolics with phosphomolybdic-phosphotungstic acid reagents. Am J Enol Vitic. 1965;16:144-58.
- Foti MC, Daquino C, Geraci C. Electron transfer reaction of cinnamic acid and their methyl esters with the DPPH• radical in alcoholic solutions. J Org Chem. 2004;69:2309-14. Available from: https://doi.org/10.1021/jo035758q
- Benzie IFF. An automated, specific, spectrophotometric method for measuring ascorbic acid in plasma [EFTSA]. Clin Biochem. 1996;29:111-6.
- Benzie IFF, Strain JJ. The ferric reducing ability of plasma as a measure of “antioxidant power”: the FRAP assay. Anal Biochem. 1996;239:70-6. Available from: https://doi.org/10.1006/abio.1996.0292
- Osman AM, Wong KKY, Fernyhough A. ABTS radical-driven oxidation of polyphenols: isolation and structural elucidation of covalent adducts. Biochem Biophys Res Commun. 2006;346:321-7. Available from: https://doi.org/10.1016/j.bbrc.2006.05.118
- Strube M, Haenen GRMM, van den Berg H, Bast A. Pitfalls in a method for assessment of total antioxidant capacity. Free Radic Res. 1997;26:515-21. Available from: https://doi.org/10.3109/10715769709097822
- Lemanska K, Szymusiak H, Tyrakowska B, Zielinski R, Soffer AEMF, Rietjens IMCM. The influence of pH on the antioxidant properties and the mechanisms of antioxidant action of hydroxyflavones. Free Radic Biol Med. 2001;31:869-81. Available from: https://doi.org/10.1016/s0891-5849(01)00638-4
- Morrison J. Molar absorptivity: the complete scientific guide. Extinctioncoefficientcalculator.com/molar-absorptivity. Published 2026 Jan 31. Accessed 2026 Oct 18.
- Kratochvilova M, Raudenska M, Heger Z, Richtera L, Cernei N, Adam V, Babula P, Novakova M, Masarik M, Gumulec J. Amino acid profiling of zinc resistant prostate cancer cell lines: associations with cancer progression. Prostate. 2017;77:604-16. Available from: https://doi.org/10.1002/pros.23304
- Klejdus B, Plaza M, Šnóblová M, Lojková L. Development of new efficient method for isolation of phenolics from sea algae before their rapid resolution liquid chromatographic–tandem mass spectrometric determination. J Pharm Biomed Anal. 2017;135:87-96. Available from: https://dx.doi.org/10.1016/j.jpba.2016.12.015.
- Singleton VL, Orthofer R, Lamuela-Raventós RM. Analysis of total phenols and other oxidation substrates and antioxidants by means of Folin-Ciocalteu reagent. Methods Enzymol. 1999;299:152-78.
- Stratil P, Klejdus B, Kubáň V. Determination of phenolic compounds and their antioxidant activity in fruits and cereals. Talanta. 2007;71:1741-51. Available from: https://doi.org/10.1016/j.talanta.2006.08.012
- Brand-Williams W, Cuvelier ME, Berset C. Use of a free radical method to evaluate antioxidant activity. Lebensm Wiss Technol. 1995;28:25-30.
- Sanchez-Moreno C, Larrauri JA, Saura-Calixto F. A procedure to measure the antiradical efficiency of polyphenols. J Sci Food Agric. 1998;76:270-6.
- Sanchez-Moreno C. Methods used to evaluate the free radical scavenging activity in foods and biological systems. Food Sci Technol Int. 2002;8:121-37.
- von Gadow A, Joubert E, Hansmann CF. Comparison of the antioxidant activity of aspalathin with that of other plant phenols of rooibos tea [Aspalathus linearis], α-tocopherol, BHT, and BHA. J Agric Food Chem. 1997;45:632-8.
- Cano A, Maestre AB, Hernández-Ruiz J, Arnao MB. ABTS/TAC methodology: main milestones and recent applications. Processes. 2023;11(1):185. Available from: https://dx.doi.org/10.3390/pr11010185.
- Miller NJ, Rice-Evans C, Davies MJ, Gopinathan V, Milner A. A novel method for measuring antioxidant capacity and its application to monitoring antioxidant status in premature neonates. Clin Sci. 1993;84:407-12. Available from: https://doi.org/10.1042/cs0840407
- Pulido R, Hernandez-Garcia M, Saura-Calixto F. Contribution of beverages to the intake of lipophilic and hydrophilic antioxidants in the Spanish diet. Eur J Clin Nutr. 2003;57:1275-82. Available from: https://doi.org/10.1038/sj.ejcn.1601685
- Cano A, Alcaraz O, Acosta M, Arnao MB. On-line antioxidant activity determination: comparison of hydrophilic and lipophilic antioxidant activity using the ABTS•+ assay. Redox Rep. 2002;7:103-9. Available from: https://doi.org/10.1179/135100002125000334
- Benzie IFF, Szeto YT. Total antioxidant capacity of teas by the ferric reducing/antioxidant power assay. J Agric Food Chem. 1999;47:633-6. Available from: https://doi.org/10.1021/jf9807768
- Gil MI. Antioxidant activity of pomegranate juice and its relationship with phenolic composition and processing. J Agric Food Chem. 2000;48:4581-9. Available from: https://doi.org/10.1021/jf000404a
- Proteggente AR, Pannala AS, Paganga G, Van Buren L, Wagner E, Wiseman S, Van De Put F, Dacombe C, Rice-Evans CA. The antioxidant activity of regularly consumed fruit and vegetables reflects their phenolic and vitamin C composition. Free Radic Res. 2002;36:217-33. Available from: https://doi.org/10.1080/10715760290006484
- Pellegrini P, Serafini M, Colombi B, Del Rio D, Salvatore S, Bianchi M, Brighenti F. Total antioxidant capacity of plant foods, beverages and oils consumed in Italy assessed by three different in vitro assays. J Nutr. 2003;133:2812-9. Available from: https://doi.org/10.1093/jn/133.9.2812
- Eyasu M, Benedí J, Romero JA, Martín-Aragón S. Antioxidant and antibacterial activities of selected medicinal plants from Addis Ababa against MDR-uro-pathogenic bacteria. Int J Mol Sci. 2024;25(19):10281. Available from: https://dx.doi.org/10.3390/ijms251910281.
- Pulido R, Bravo L, Saura-Calixto F. Antioxidant activity of dietary polyphenols as determined by a modified FRAP assay. J Agric Food Chem. 2000;48:3396-402. Available from: https://doi.org/10.1021/jf9913458
- Ou B, Huang D, Hampsch-Woodill M, Flanagan J, Deemer E. Analysis of antioxidant activities of common vegetables employing oxygen radical absorbance capacity [ORAC] and ferric reducing antioxidant power [FRAP] assays: a comparative study. J Agric Food Chem. 2002;50:3122-8.
- Cao G, Prior RL. Measurement of total antioxidant capacity in nutritional and clinical studies. In: Cadenas E, Packer L, editors. Handbook of antioxidants. New York: Dekker; 2001. p. 47-55.
- Erel O. A novel automated direct measurement method for total antioxidant capacity using a new generation, more stable ABTS radical cation. Clin Biochem. 2004;37:277-85. Available from: https://doi.org/10.1016/j.clinbiochem.2003.11.015
- Cao G, Sofic E, Prior RL. Antioxidant and prooxidant behavior of flavonoids: structure-activity relationships. Free Radic Biol Med. 1997;22:749-60. Available from: https://doi.org/10.1016/s0891-5849(96)00351-6
- Imeh U, Khokhar S. Distribution of conjugated and free phenols in fruits: antioxidant activity and cultivar variations. J Agric Food Chem. 2002;50:6301-6. Available from: https://doi.org/10.1021/jf020342j
- Valgimigli L, Banks JT, Ingold KU, Lusztyk J. Kinetic solvent effects on hydroxyl hydrogen atom abstractions are independent of the nature of the abstracting radical. Two extreme tests using vitamin E and phenol. J Am Chem Soc. 1995;117:9966-74. Available from: https://dx.doi.org/10.1021/ja00145a005.
- NAS. Panel on dietary antioxidants and related compounds. Food and Nutrition Board. Vitamin C, vitamin E, selenium, and β-carotene and other carotenoids: overview, antioxidant definition, and relationship to chronic disease. In: Dietary reference intakes for vitamin C, vitamin E, selenium, and carotenoids. Washington (DC): National Academy of Science; 2000. p. 35-57.
- Lojková L, Pluháčková H, Benešová K, Kudláčková B, Cerkal R. The highest yield, or greener solvents? Latest trends in quercetin extraction methods. TrAC Trends Anal Chem. 2023;167:117229. Available from: https://dx.doi.org/10.1016/j.trac.2023.117229.
- Cerkal R, Benešová K, Kudláčková B, Pluháčková H, Lojková L. Green solvents in pressurized liquid extraction from onion solid waste: trendy, required by legislation, or successfully competitive? Microchem J. 2026;220:116288. Available from: https://dx.doi.org/10.1016/j.microc.2025.116288.
- Klejdus B, Plaza M, Bartáková M, Lojková L. Development of a new efficient method for isolation of phenolics from sea algae before their rapid resolution liquid chromatographic-tandem mass spectrometric determination. J Pharm Biomed Anal. 2017;135:87-96. Available from: https://dx.doi.org/10.1016/j.jpba.2016.12.015.
- Klejdus B, Lojková L, Vlček J. Hyphenated solid phase extraction/supercritical fluid extraction methods for extraction of phenolic compounds from algae. Curr Anal Chem. 2014;10(1):86-98.
- Klejdus B, Lojková L, Plaza M, Šnóblová M, Štěrbová D. Hyphenated technique for the extraction and determination of isoflavones in algae: ultrasound-assisted supercritical fluid extraction followed by fast chromatography with tandem mass spectrometry. J Chromatogr A. 2010;1217(51):7956-65. Available from: https://dx.doi.org/10.1016/j.chroma.2010.07.020.



 Save to Mendeley
Article Alerts
Subscribe to our articles alerts and stay tuned.
 This work is licensed under a Creative Commons Attribution 4.0 International License.